Introduction:
Prometheus is an open-source systems monitoring and alerting toolkit .It offers a multi-dimensional data model, a flexible query language, and diverse visualization possibilities through tools like Grafana.
Step 1 — Creating Service Users
For security purposes, we’ll begin by creating two new user accounts, prometheus and node_exporter. We’ll use these accounts throughout the tutorial to isolate the ownership on Prometheus’ core files and directories. Create these two users, and use the –no-create-home and –shell /bin/false options so that these users can’t log into the server.
sudo useradd --no-create-home --shell /bin/false prometheus
Before we download the Prometheus binaries, create the necessary directories for storing Prometheus’ files and data. Following standard Linux conventions, we’ll create a directory in /etc for Prometheus’ configuration files and a directory in /var/lib for its data.
sudo mkdir /etc/prometheus
sudo mkdir /var/lib/prometheus
Now, set the user and group ownership on the new directories to the prometheus user.
sudo chown prometheus:prometheus /etc/prometheus
sudo chown prometheus:prometheus /var/lib/prometheus
Step 2 — Downloading Prometheus
curl -LO https://github.com/prometheus/prometheus/releases/download/v2.38.0/prometheus-2.38.0.linux-amd64.tar.gz
Now, unpack the downloaded archive.
tar xvf prometheus-2.38.0.linux-amd64.tar.gz
Copy the two binaries to the /usr/local/bin directory.
sudo cp prometheus-2.38.0.linux-amd64/prometheus /usr/local/bin/
sudo cp prometheus-2.38.0.linux-amd64/promtool /usr/local/bin/
Set the user and group ownership on the binaries to the prometheus user created in Step 1.
sudo chown prometheus:prometheus /usr/local/bin/prometheus
sudo chown prometheus:prometheus /usr/local/bin/promtool
Copy the consoles and console_libraries directories to /etc/prometheus.
sudo cp -r prometheus-2.38.0.linux-amd64/consoles /etc/prometheus
sudo cp -r prometheus-2.38.0.linux-amd64/console_libraries /etc/prometheus
Copy the configuration file prometheus.yml to /etc/prometheus
sudo cp -r prometheus-2.38.0.linux-amd64/prometheus.yml /etc/prometheus
Set the user and group ownership on the directories to the prometheus user. Using the -R flag will ensure that ownership is set on the files inside the directory as well.
sudo chown -R prometheus:prometheus /etc/prometheus/consoles
sudo chown -R prometheus:prometheus /etc/prometheus/console_libraries
sudo chown prometheus:prometheus /etc/prometheus/prometheus.yml
Lastly, remove the leftover files from your home directory as they are no longer needed.
rm -rf prometheus-2.38.0.linux-amd64.tar.gz prometheus-2.38.0.linux-amd64
Now that Prometheus is installed, we’ll run it with its default configuration.
Step 3 — Running Prometheus
Start up Prometheus as the prometheus user, providing the path to both the configuration file and the data directory.
sudo -u prometheus /usr/local/bin/prometheus \
    --config.file /etc/prometheus/prometheus.yml \
    --storage.tsdb.path /var/lib/prometheus/ \
    --web.console.templates=/etc/prometheus/consoles \
    --web.console.libraries=/etc/prometheus/console_libraries
The output contains information about Prometheus’ loading progress, configuration file, and related services. It also confirms that Prometheus is listening on port 9090.
Output:
level=info ts=2022-08-23T11:34:29.638282857Z caller=main.go:215 msg="Starting Prometheus" version="(version=2.38.0, branch=HEAD, revision=0a74f98628a0463dddc90528220c94de5032d1a0)"
level=info ts=2022-08-23T11:34:29.638328622Z caller=main.go:216 build_context="(go=go1.9.2, user=root@615b82cb36b6, date=20171108-07:11:59)"
level=info ts=2022-08-23T11:34:29.638341759Z caller=main.go:217 host_details="(Linux 4.15.0-124-generic #127-Ubuntu SMP Fri Nov 6 10:54:43 UTC 2020 x86_64 ubuntu (none))"
level=info ts=2022-08-23T11:34:29.643323453Z caller=main.go:314 msg="Starting TSDB"
level=info ts=2022-08-23T11:34:29.643376804Z caller=web.go:380 component=web msg="Start listening for connections" address=0.0.0.0:9090
level=info ts=2022-08-23T11:34:29.64350914Z caller=targetmanager.go:71 component="target manager" msg="Starting target manager..."
level=info ts=2022-08-23T11:34:29.728814308Z caller=main.go:326 msg="TSDB started"
level=info ts=2022-08-23T11:34:29.728871299Z caller=main.go:394 msg="Loading configuration file" filename=/etc/prometheus/prometheus.yml
level=info ts=2022-08-23T11:34:29.729515699Z caller=main.go:371 msg="Server is ready to receive requests."
Now, halt Prometheus by pressing CTRL+C, and then open a new systemd service file.
sudo vim /etc/systemd/system/prometheus.service
The service file tells systemd to run Prometheus as the prometheus user, with the configuration file located in the /etc/prometheus/prometheus.yml directory and to store its data in the /var/lib/prometheus directory. (The details of systemd service files are beyond the scope of this tutorial, but you can learn more at Understanding Systemd Units and Unit Files.)
Copy the following content into the file: Prometheus service file - /etc/systemd/system/prometheus.service
[Unit]
Description=Prometheus
Wants=network-online.target
After=network-online.target

[Service]
User=prometheus
Group=prometheus
Type=simple
ExecStart=/usr/local/bin/prometheus \
    --config.file /etc/prometheus/prometheus.yml \
    --storage.tsdb.path /var/lib/prometheus/ \
    --web.console.templates=/etc/prometheus/consoles \
    --web.console.libraries=/etc/prometheus/console_libraries

[Install]
WantedBy=multi-user.target
Finally, save the file and close your text editor.
To use the newly created service, reload systemd.
sudo systemctl daemon-reload
You can now start Prometheus using the following command:
sudo systemctl start prometheus
To make sure Prometheus is running, check the service’s status.
sudo systemctl status prometheus
The output tells you Prometheus’ status, main process identifier (PID), memory use, and more.
If the service’s status isn’t active, follow the on-screen instructions and re-trace the preceding steps to resolve the problem before continuing the tutorial.
Output:
● prometheus.service - Prometheus
   Loaded: loaded (/etc/systemd/system/prometheus.service; enabled; vendor preset: enabled)
   Active: active (running) since Tue 2022-08-23 11:41:38 UTC; 6s ago
 Main PID: 32063 (prometheus)
    Tasks: 14 (limit: 4915)
   CGroup: /system.slice/prometheus.service
           └─32063 /usr/local/bin/prometheus --config.file /etc/prometheus/prometheus.yml --storage.tsdb.path /var/lib/prometheus/ --web.console.templates=/etc/prometheu
Aug 23 11:41:38 ubuntu systemd[1]: Started Prometheus.
Aug 23 11:41:38 ubuntu prometheus[32063]: level=info ts=2022-08-23T11:41:38.458Z caller=main.go:215 msg="Starting Prometheus"
Aug 23 11:41:38 ubuntu prometheus[32063]: level=info ts=2022-08-23T11:41:38.561Z caller=main.go:371 msg="Server is ready to receive requests."
When you’re ready to move on, press Q to quit the status command.
Lastly, enable the service to start on boot.
sudo systemctl enable prometheus
Access the prometheus from webpage.
http://<prometheus-ip>:9090/graph
Step 4 — Downloading Node Exporter
Prometheus uses piece of software called (node exporter). It collect metrics from the server and OS level and then send these date to Prometheus server. We are going to download and install node_exporter on the same server Prometheus running on, and then we are going to redo it on separate node.
Create node_exporter user.
sudo useradd --no-create-home --shell /bin/false node_exporter
Download node exporter with the following command
curl -LO https://github.com/prometheus/node_exporter/releases/download/v1.3.1/node_exporter-1.3.1.linux-amd64.tar.gz
Now, unpack the downloaded archive.
tar xvf node_exporter-1.3.1.linux-amd64.tar.gz
Copy the binary to the /usr/local/bin directory and set the user and group ownership to the node_exporter user that you created in Step 1.
sudo cp node_exporter-1.3.1.linux-amd64/node_exporter /usr/local/bin
sudo chown node_exporter:node_exporter /usr/local/bin/node_exporter
Step 5 — Running Node Exporter
The steps for running Node Exporter are similar to those for running Prometheus itself. Start by creating the Systemd service file for Node Exporter.
sudo vim /etc/systemd/system/node_exporter.service
This service file tells your system to run Node Exporter as the node_exporter user with the default set of collectors enabled.
Copy the following content into the service file:
[Unit]
Description=Node Exporter
Wants=network-online.target
After=network-online.target

[Service]
User=node_exporter
Group=node_exporter
Type=simple
ExecStart=/usr/local/bin/node_exporter

[Install]
WantedBy=multi-user.target
Collectors define which metrics Node Exporter will generate. You can see Node Exporter’s complete list of collectors — including which are enabled by default and which are deprecated — in the Node Exporter README file.
If you ever need to override the default list of collectors, you can use the --collector.disable-defaults --collector.<NAME> flags, like:
sudo vim /etc/systemd/system/node_exporter.service
ExecStart=/usr/local/bin/node_exporter --collector.disable-defaults --collector.meminfo --collector.loadavg
The preceding example would tell Node Exporter to generate metrics using only the meminfo, and loadavg collectors. You can limit the collectors to however few or disable all of them by this flag --no-collector.<name>.
Save the file and close your text editor.
Finally, reload systemd to use the newly created service.
sudo systemctl daemon-reload
sudo systemctl start node_exporter
sudo systemctl status node_exporter
sudo systemctl enable node_exporter
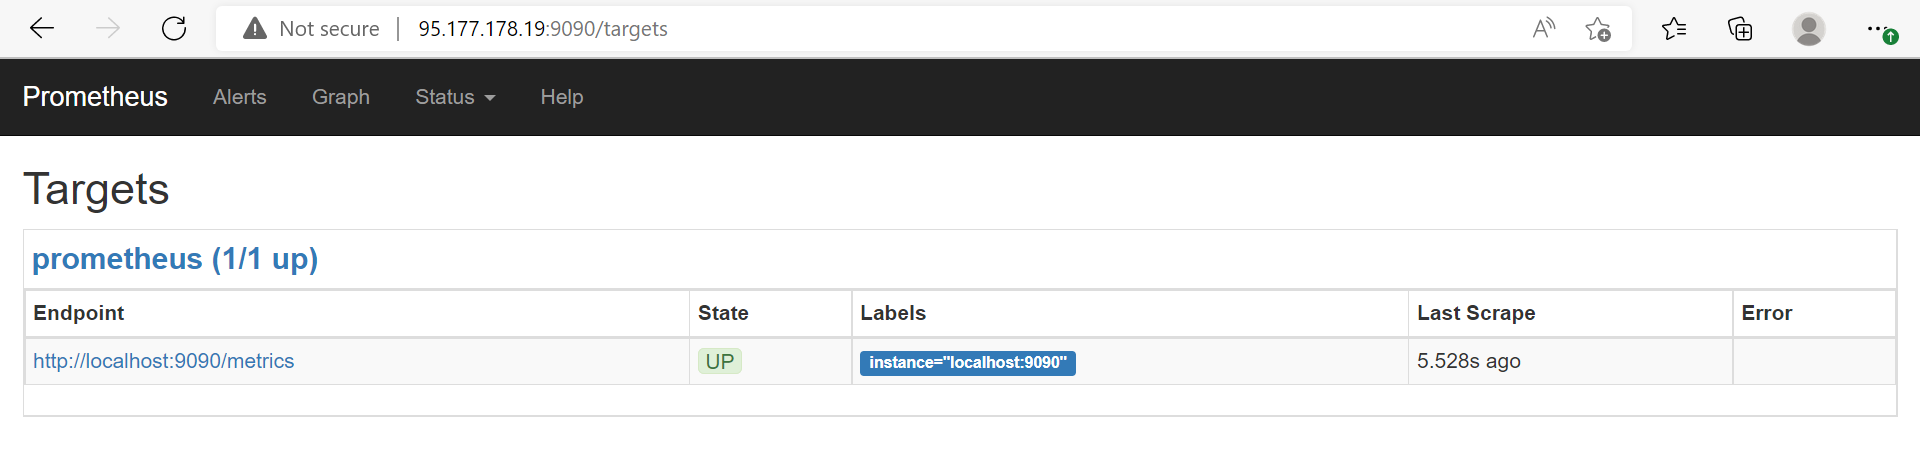
Now, the node exporter start collect metrics and send it to Prometheus. And, if you check the target in prometheus web UI http://<prometheus-ip>:9090/targets , you will be able to see the status as shown below.
Adding new node
To collect metrics from new node, you have to redo step 5 on new server, and reconfigure prometheus.yml installed in step 2 by adding the Following.
In Prometheus server edit the configuration file with this command.
sudo vim /etc/prometheus/prometheus.yml
In the static_configs: section, add new job name and the new node private IP.
- job_name: '<JOB_NAME>'
  static_configs:
    - targets: ['<NEW_NODE_PRIVATE_IP>:9100']
The complete prometheus.yml file will look like This
# my global config
global:
  scrape_interval:     15s # Set the scrape interval to every 15 seconds. Default is every 1 minute.
  evaluation_interval: 15s # Evaluate rules every 15 seconds. The default is every 1 minute.
  # scrape_timeout is set to the global default (10s).

# Alertmanager configuration
alerting:
  alertmanagers:
  - static_configs:
    - targets:
      # - alertmanager:9093

# Load rules once and periodically evaluate them according to the global 'evaluation_interval'.
rule_files:
  # - "first_rules.yml"
  # - "second_rules.yml"

# A scrape configuration containing exactly one endpoint to scrape:
# Here it's Prometheus itself.
scrape_configs:
  # The job name is added as a label `job=<job_name>` to any timeseries scraped from this config.
  - job_name: 'prometheus'

    # metrics_path defaults to '/metrics'
    # scheme defaults to 'http'.

    static_configs:
      - targets: ['localhost:9090']
  - job_name: 'Ubuntu server'
    static_configs:
      - targets: ['192.168.0.4:9100']
For changes to be effected restart Prometheus using the following command:
sudo systemctl restart prometheus
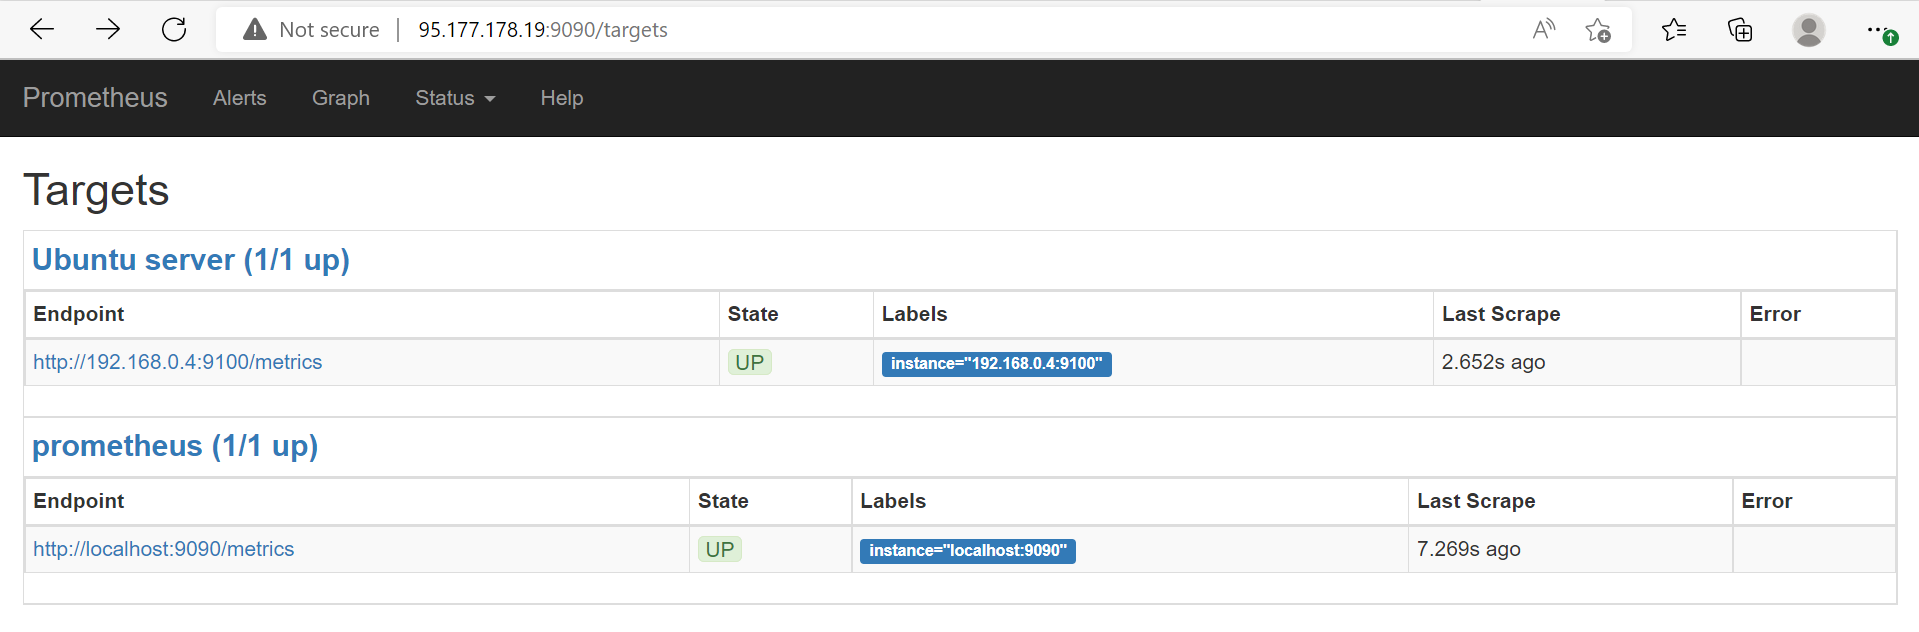
Access the prometheus from Webpage
http://<prometheus-ip>:9090/graph
Step 6 – Add Prometheus Data Source To Grafana
If you want to download and install Grafana please refer to its documentation. For this demo we used the latest version 9.1.1 as of August 2022.
Note: Make sure Prometheus endpoint is accessible from Grafana server.
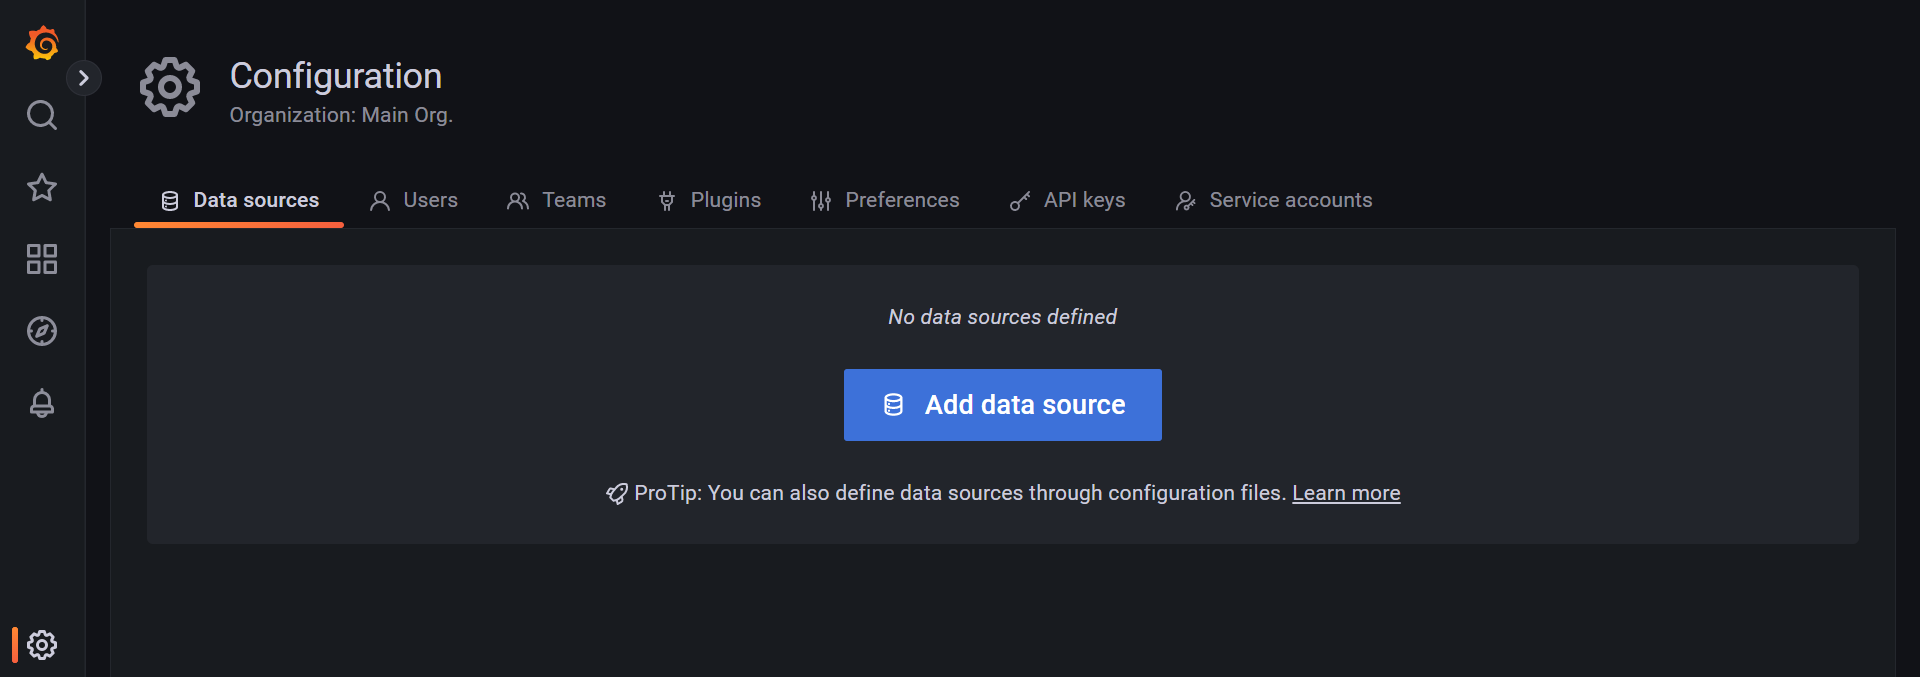
From the left side menu navigate to Home > Configuration > and click on
Data source.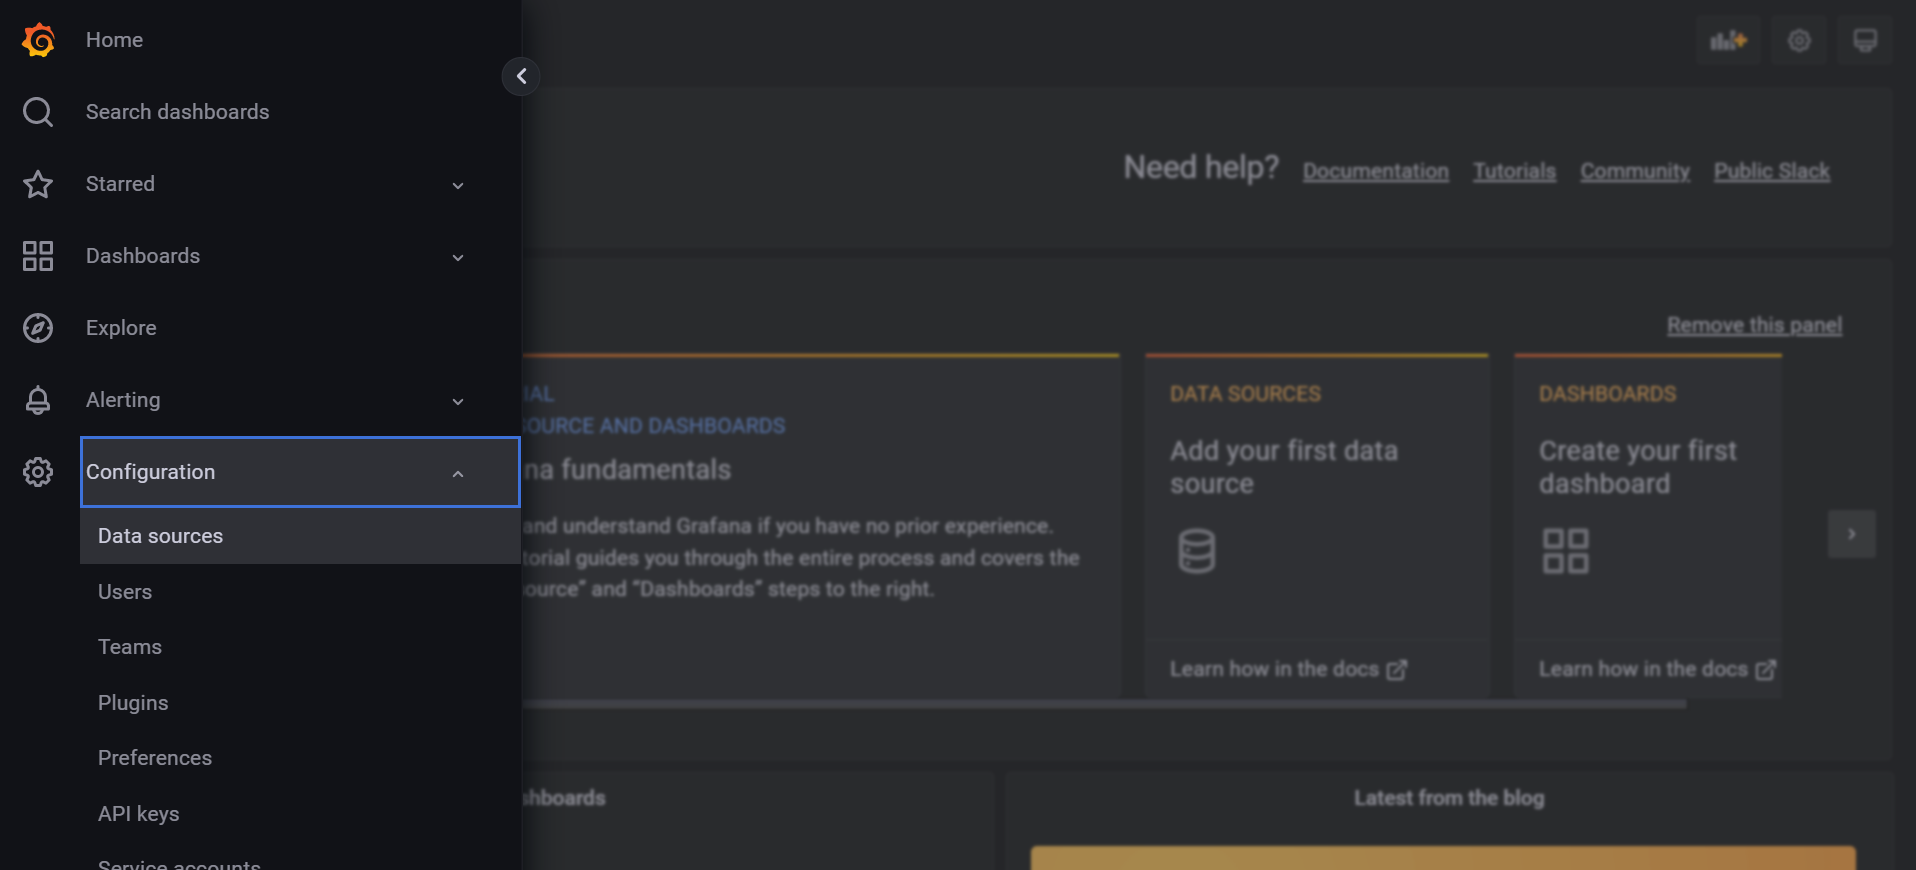
Click the “add source” option.
From the
Time series databasesoptions choose Prometheus.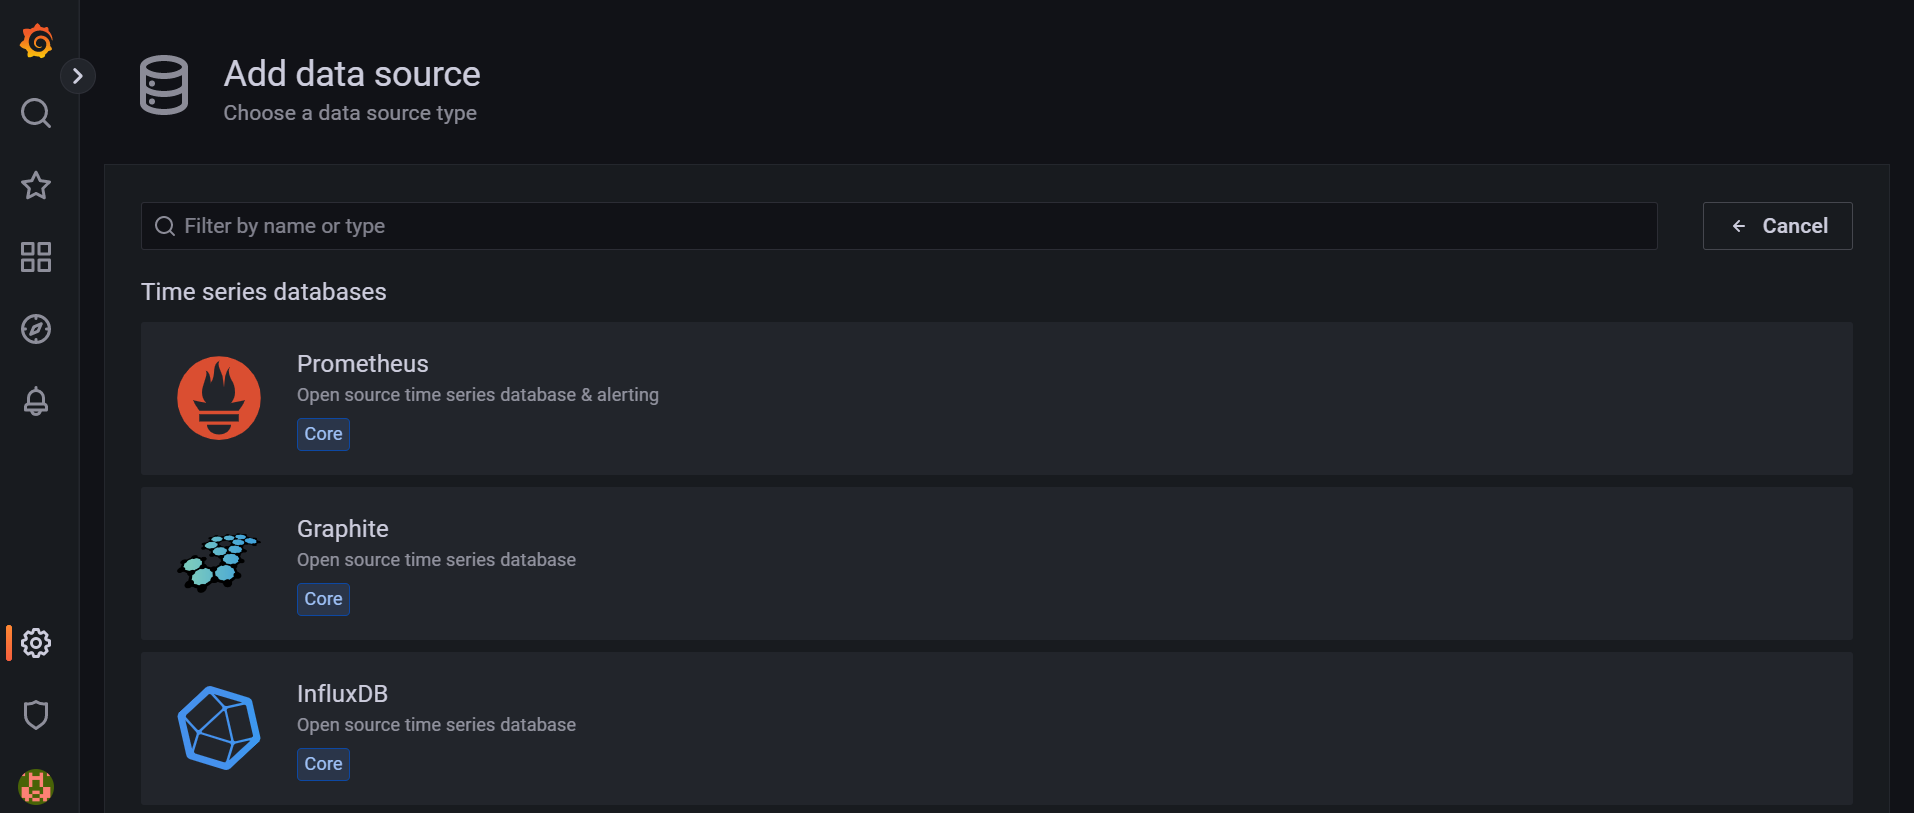
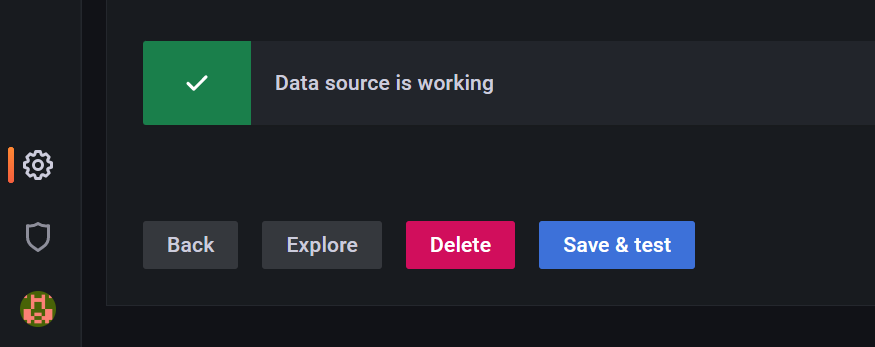
Add the source name, Prometheus endpoint details and save it.
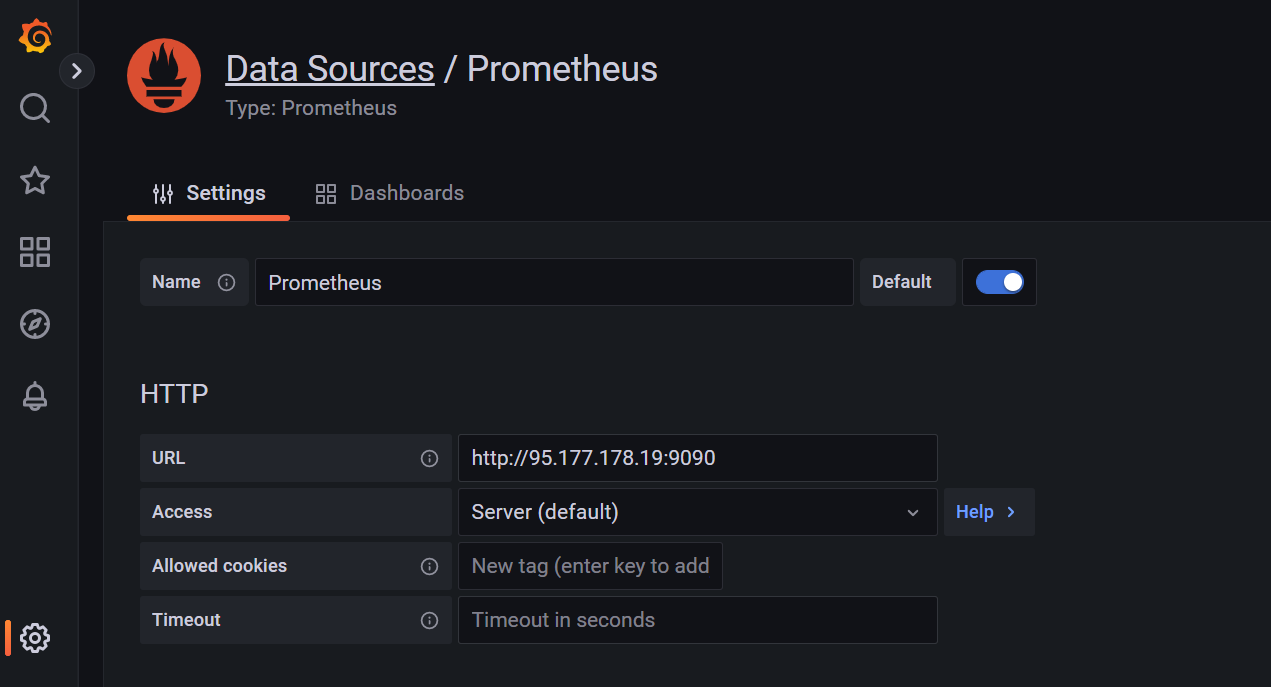
Scroll down and click Save and test, and if it success it will look like this.